
Analyzer
The Analyzer is the tool that allows you to compare the same price list or different price lists (with the same or different columns) to highlight price variations. It is useful for checking increases, decreases, or anomalies between subsequent price lists or between different calculation simulations.
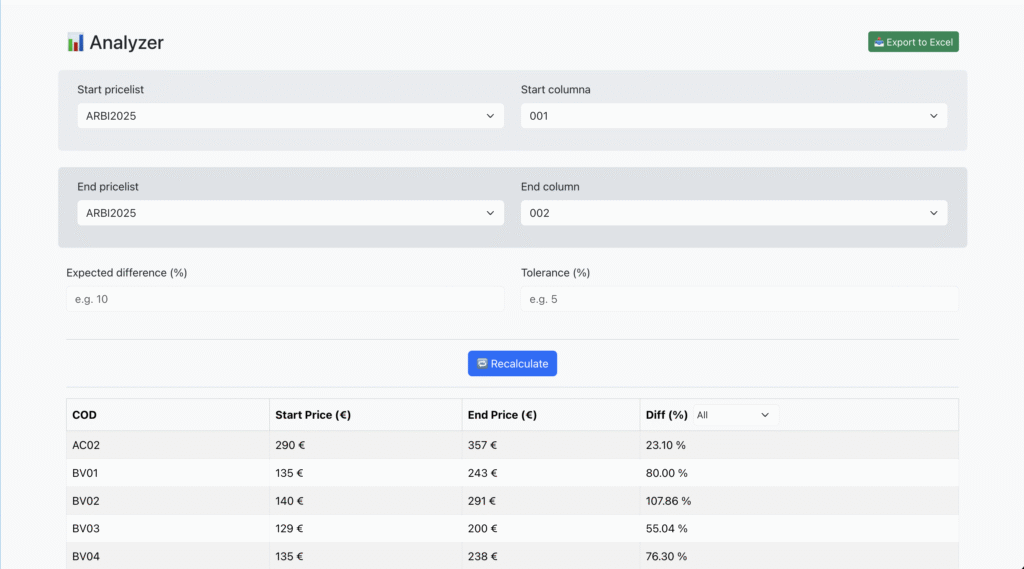
In the Analyzer screen, the following fields and functions are available:
1. Start pricelist / End pricelist
Allows you to select the two pricelists to compare.
Generally, the same pricelist is compared (e.g., PRICELIST2025) but in two different columns, or two different pricelists (e.g., 2024 vs 2025).
2. Start column / End column
Each pricelist can contain multiple price columns (e.g., base pricelists, variants, discounts).
Here you select the starting and ending column for the comparison.
3. Expected difference (%)
Optional field where the user can enter the expected percentage change.
Example: if an average increase of 10% is expected, entering this value will help the Analyzer identify items that deviate from the average.
4. Tolerance (%)
Optional field that defines the acceptable tolerance threshold.
Example: with a 5% tolerance, only rows exceeding ±5% compared to the expected difference will be highlighted.
5. Recalculate
After setting the parameters, press Recalculate to update the data.
The table will show the price differences between the selected pricelists/columns.
6. Export to Excel
Allows you to download the comparison result in Excel format for further analysis or archiving.
Results Table
The table shows for each item:
COD → Item code.
Start Price (€) → Starting price (list/initial column).
End Price (€) → Ending price (list/comparison column).
Diff (%) → Automatically calculated percentage difference.
Diff Filter (%) → Allows quick filtering of results based on the difference (all, positive, negative, etc.).
Typical operational flow
Select the starting price list and the comparison price list.
Choose the columns to compare.
(Optional) Set an expected difference and a tolerance.
Press Recalculate to view the results.
Analyze the differences through the table or export the data to Excel.